|
We will start work on the development environment by creating the
simplest application and will gradually use the functions and show the
properties of the basic components of the system. This Chapter cannot
introduce all virtual instruments and all manners of their use.
Rather, it shows the basic procedures and the number of individual
complicated instruments will increase in subsequent chapters.
Step 1 — the simplest
application
The typical first application described in various textbooks
about programming is as a rule writing the sentence “hello
world”. The Control Web is a tool of another
level than a programming language compiler — several series of components are available with
already built-in rich functionality, so we can start considerably
complicated applications. Our objective will be to display
analogue (continuous) value.
The Control Web IDE allows working in several
editors, which can be switched between using toolbar, always
located right under the window title.
Hint: The toolbar is the only firmly placed part of the GUI of
the Control Web system. All other commands and
instruments are located in palettes, which can be organized at
your will. Since the application in source text is always stored in text
form, the first editor offered by the development environment is
the Text editor. Theoretically, any application in the
Control Web system can be created using only text
editor, provided the user knew all parameters of all required
components, data sections etc. Given the extent it is apparently
difficult and also uneconomic and that is why the Control Web offers other editors that make the creation of
applications simpler and faster. We will continue to work in the
mode of graphics editor and its supporting command and tool
palettes. Let's just make sure that Graphics editor is
selected in the toolbar (button  is highlighted).
If you start the Control Web in default
configuration, a palette called Applications is on the
upper left (under the line enabling editor switching).
If the Applications palette is not visible (is
covered with other palette), all you need to do is click the tab
with the name and the palette immediately pops up). Command
buttons in this palette allow, among other things, saving,
starting and stopping the application.
After you click on the  button, the introductory window will open, making it possible to
create a new application or select an existing application for
further editing. The opening of a demo example is also offered.
However, we want to start working on a new application.
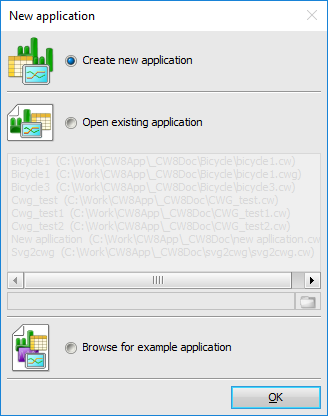
New application creation window After pressing the OK button, the first page
New Application Wizard is opened, which requires the
typing of the name of the file in which the application will be
stored. Let’s name the application 'first', the file
'first.cw' is created. Although New Application
Wizard offers the creation of an easy structure of
application and, of course, in real implementation it is
preferable to use the wizard, now, for didactic reasons, we reject
its further services and are satisfied with the creation of an
empty application file by clicking on the Finish.
Hint: New Application Wizard offers on the first
page not only the name, but also the folder where the file should
be stored. The folder 'Control Web Projects' is offered
as the default setting in the document folder ('My
Documents' in the English versions of Windows) of just the
logged-in user. It is possible to store in another folder in which
the user must have the right to create files and store
them. Make sure the development environment is in the graphic mode
(the tab Graphic editor) is selected. Using the tool
 open the window Instrument
Palette. Make sure that in the list of options above the
tree structure in the left part of the palette window the option
Instrument categories is selected (not Instrument
libraries). If you want to display a continuous value,
gradually expand the sub-tree Flat instruments,
Display and Continuous. The palette window
will appear like this: open the window Instrument
Palette. Make sure that in the list of options above the
tree structure in the left part of the palette window the option
Instrument categories is selected (not Instrument
libraries). If you want to display a continuous value,
gradually expand the sub-tree Flat instruments,
Display and Continuous. The palette window
will appear like this:
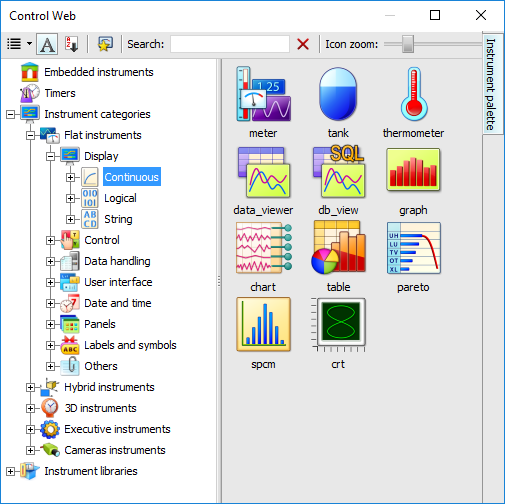
Instruments palette displaying flat instruments to
display continuous values Drag by mouse the instrument meter on the
desktop of the graphic editor. In the application there is one
instrument making it possible to display continuous value. To see
that the instrument works, we need to change this value somehow
(to set). Return to the window Instrument Palette and
gradually expand the tree structure Flat instruments,
Control and Continuous. Among these
instruments there is the control instrument which
carries out exactly what we want — sets
continuous values. Drag it by mouse to the application beside the
instrument meter. In the graphic editor we can see
both instruments:
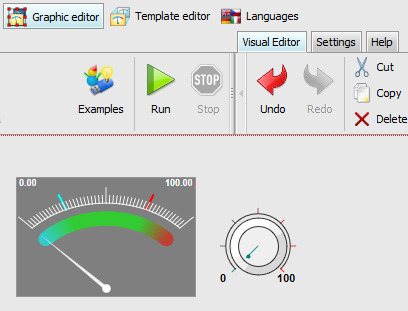
Instrumentsmeter and
control in the graphic editor Now we have in the application two instruments, one can measure
the set value and the second can display it. However, there is no
place where this value can be stored. To store the value, it is
necessary to define the data element.
Select in the development environment the tab Data
Inspectors. In the application there is not yet any data
section within which it would be possible to edit the data
element. For our purposes we need a simple variable capable of
storing continuous values. Select var from the
predefined sections of the subtree in the left part of data
inspectors space, which is a type of section storing variables. If
the var section in the subtree does not exist yet,
click item <add section> and select
var. Within the section there can be several types of
variables — scalar variables, variable
arrays and buffer type variables. Select the simple
(Scalar) variables and write into the table in the
right part the name of the variable (e.g. value). It
is also necessary to select the type. Continuous values are
represented by the type real (real number).
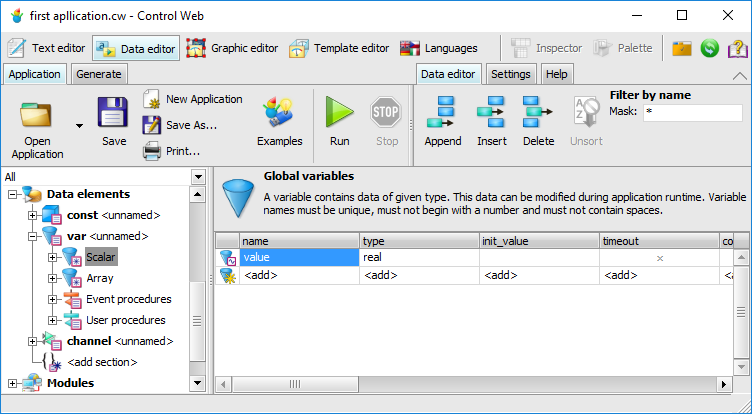
Newly defined variable value of the type
real Now we can return to the graphic environment — select the tab Graphic editor. The next
step during the creation of the application will be
“connection” of instruments to the data element — Instrument control must write the
value of the data element value and the instrument
meter must display it. These abilities (writing of
the value and its display) are characteristic of the selected
instruments (control and meter) but
it is necessary to specify for each instrument which data element
it is necessary to work with. Since it concerns properties of
instruments, it is necessary to specify them in the
Instrument Inspector window opened for the instrument
in question. You can open this window from the context menu of the
respective instrument (it is opened after right-clicking with the
mouse on the desktop of the instrument in the development
environment).
Hint: The development environment makes it possible to select
whether the right mouse button opens on particular instrument’s
context menu, from which it is possible to open Instrument
Inspector or directly the Inspector Window. Operations
mentioned in the context menu can be executed only by keys, so
quick opening of the inspector may save time for more experienced
users. Instrument Inspector has several tabs in which it is possible
to define different parts of the instrument in question. Lets
start with the first tab Properties. This tab displays
all parameters which can be set for the respective instrument.
Open the inspector over the instrument control and
select the parameter output.
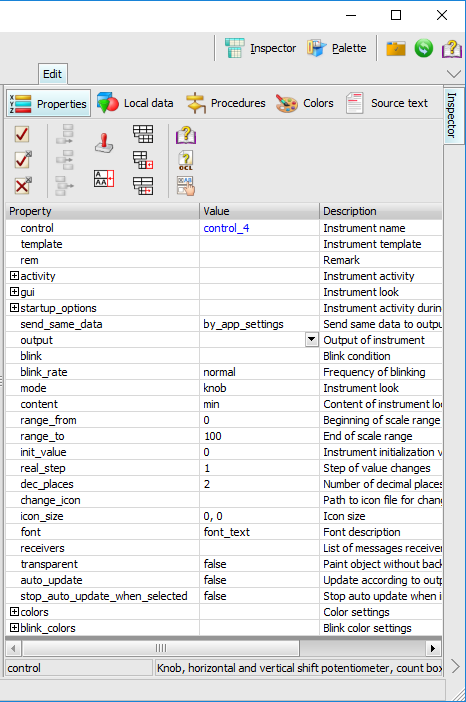
Instrument Inspector of the control
instrument with the selected parameter output. Hint: As well as all command and tool palettes in the
Control Web development environment, even
Inspector can be configured according to
user's preferences. Standardly, the inspector is displayed as a
palette on the right side of the development environment window,
as shown in the previous picture. All you need to do is grab the
Inspector tab with your mouse and drag it outside the
development environment window and the Inspector will
be placed in a separate window as in the previous version of the
Control Web. The third option is to keep the palette in the
main window, but roll it up. Only the tab with the name will
remain visible from the palette. If the palette is needed, it
rolls out into full size. When it is no longer needed, it roll
back up. The palette then takes only a minimum of space and the
display space if available for the application itself. All
these options of customization involve all palettes of the
Control Web system. More about the
Control Web The parameter output specifies the data element
where the value will be recorded. How do we know that for the
instrument control it is necessary to set the
parameter output? The Inspector displays the
description for all parameters, which may help for the first
orientation. After some time you will use the basic parameters
without problems, just like pressing the clutch and engaging a
speed when driving.
Write into the field the name of the previously defined
variable value. If you are not sure which data
element it is necessary to use, use the auxiliary inspector panel,
which offers all the defined data elements of the suitable
type:
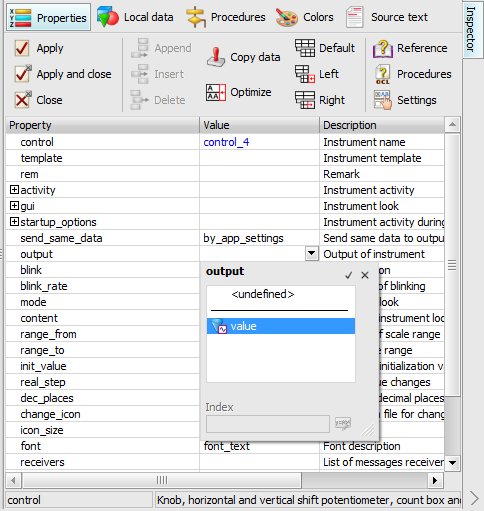
Auxiliary pop-up window offers defined data
elements Changes in values of parameters carried out in the
inspectors are not reflected in the application as long as you
decide to confirm them. Of course, you may think it over and
cancel the performed changes before confirmation. The first
three tools in the Inspector window have the following
meaning:  | Confirmation of changes. The existing changes in the
inspector are reflected in the application but the inspector
remains open. |  | Confirmation of changes and closing the inspector. The
existing changes in the inspector are reflected in the
application and the inspector is closed. |  | Cancellation of changes. The existing changes in the
inspector are forgotten and the inspector is closed. |
If in the parameter output contains the name
value, confirm the changes and open the inspector
above the instrument meter. Here, select the
parameter expression and write into it the name of
the data element value.
Creating of our simplest application is nearly finished, but
the application in existing form will not work according to our
expectations. The instrument control will write the
respective value during each user action into the variable value
but no manner of activation of the instrument meter
is defined. Instruments, which do not work on the basis of some
action of the user (e.g.control), perform their
activities at the moment of activation and, therefore, it is
necessary for the instrument meter to ensure
activation. The simplest manner is to specify timing for the
meter instrument. Set the period
parameter value to 0.1 in the inspector. This
will ensure that the instrument meter will be
activated ten times per second, i.e. the expression mentioned in
the parameter-times per second, that means the expression defined
in the expression parameter will be evaluated and the
result will be displayed (the pointer will turn).
Warning: Decimal places in the Control Web
system are separated by dots regardless of the regional
settings. Hint: If you open the inspector above the instrument
meter, you will not find the parameter period
in the list of parameters at the first level. To increase the
lucidity, the inspector does not display all parameters in one
list, but some logically linked groups of parameters are displayed
in independent sub-tables, which can be unrolled and collapsed. An
example of such groups is activity group, which
contains parameters for condition settings of instrument
activation. In the rolled form it is hidden in one
line: 
Rolled form of standard parameters When you click on the symbol + you will unroll the
table with the standard parameters: 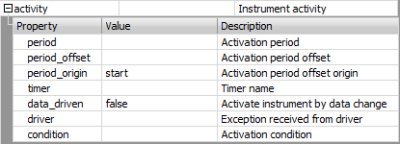
Unrolled standard parameters Run the application by clicking on the  tool in the development environment. As
soon as the application runs, try to set the value using the
instrument control and observe how the instrument
meter displays the value. tool in the development environment. As
soon as the application runs, try to set the value using the
instrument control and observe how the instrument
meter displays the value.
Stop the application using the  tool in the development environment or
by means of the menu, which can be opened by clicking the mouse on
the Control Web running application icon in the
icon tray (on the right side of the Windows task bar): tool in the development environment or
by means of the menu, which can be opened by clicking the mouse on
the Control Web running application icon in the
icon tray (on the right side of the Windows task bar):
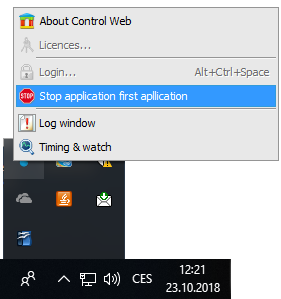
Menu of the of the Control Web running
application Step 2 — Instrument parameters
If the first application works, you may start to modify it.
Let’s consider that you are not satisfied with the setting of the
value — instead of the rotating control knob
we want the vertical slider. The function of the instrument
remains the same, we only want to change its look. It is not
necessary to use another instrument, control offers
a series of possible looks.
Looks may be changed by means of the parameter mode.
If the parameter mode is selected in the inspector
you will get the offer of all possible modes of the instrument.
Select the value vertical_slider. After confirmation
of changes in the inspector the visual form of the instrument
control is changed, however, its dimensions remain
unchanged. The square is not a suitable form for the vertical
slider, so select the instrument in the development environment
and change its dimensions according to requirements using the
dragging points. The graphical form of the application is as
follows:
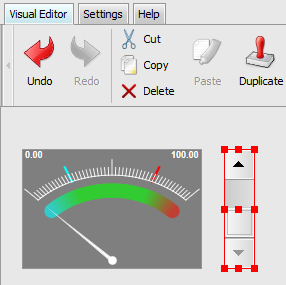
Application after the change of mode of the
control instrument Similarly, you can modify the form of the instrument
meter. For example, you want to see the graph of
values displayed by the instrument for the last 10 seconds.
Because the instrument meter is timed 10× per second, it will be activated
100× within 10 seconds. So, change
two parameters of the instrument meter: First of
all, set the parameter mode for the value flow_graph
(even though the parameter mode is similar to the
parameter of the instrument control with the same
name, it is necessary to take into consideration that this
similarity only simplifies remembering the names of parameters,
otherwise they are quite different parameters of two different
instruments). Then set the value of the parameter history
for 100 (so that the instrument displays the 100 last values). It
is possible to change on the instrument meter the
parameter content for the value med.
This parameter specifies the richness of display and the medium
value causes displaying of the actual value of the expression
expression outside the simple graph. After these
changes the application looks as follows:
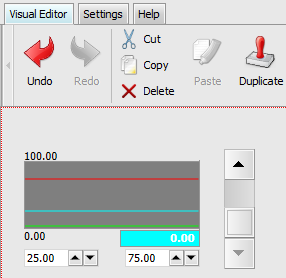
Application after the change of the mode and the
content of the instrument meter Hint: Because the form of many instruments can be considerably
changed by its parameters, these forms of one instrument are
offered directly by Instruments Palette. If you click
in the tree in the left part of the palette directly on the
particular instrument, possible forms of the respective instrument
will appear in the right part (if the instrument supports more
forms). For example, the instrument meter can be
simply dragged in the form of a graph directly from the
palette: 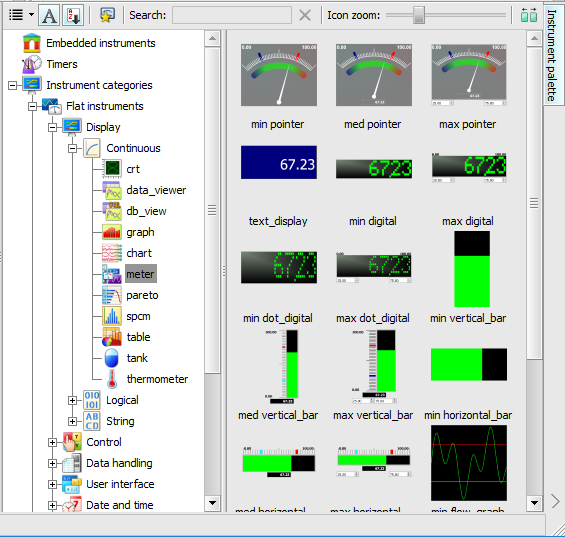
Palette of instruments with various forms of the
instrument meter The running application looks like this:
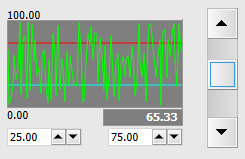
Running application with modified form of instruments
meter and control Step 3 — panels and windows
The currently created application creates virtual instruments
directly on the Windows desktop, where instruments can be
overlapped, for example, by windows of other applications. The
Control Web system brings absolute freedom into
the creation of the visual form of the application. It is evident
from previous applications that it is possible to build an
application quite freely and that the Control Web
does not enforce any “main application window” with the
title, etc. If you want to place the application into the window,
there are no obstacles to doing so.
First of all, we mention the organization of elements of the
graphic user interface (GUI), because visible virtual instruments
represent the graphic user interface of the application. From the
first GUI systems its individual elements (windows, buttons, menu,
etc.) have been organized into a hierarchic structure. Some GUI
elements are superior to other elements. We say that superior
elements “own” subordinate elements. For example, the
dialog window owns edit boxes, check boxes or command buttons.
This structure is not only single-level, one element may be owned
by a higher element and, at the same time, own lower elements.
For organization of GUI elements it is valid
that:
Individual GUI components represents a hierarchical
(tree) structure. The root of this tree is the desktop. Each GUI element has an owner (with the exception of the
desktop). Some elements (e.g. windows) may own other subordinate
elements. In addition to relations “to own” and “to be
owned” for each GUI element occupies a rectangle, which
defines its area. The position of each element is always
determined in relation to the owner. The area (rectangle) of any element cannot exceed the
area of its owner. If the area of the element is larger than the
area of the owner, the parts exceeding the area of the owner
will not be displayed (the element will be “slipped” by
the rectangle of the owner). If two elements are at the same level (they have the same
owner) and their areas overlap, the so-called z-coordinate
decides their display. So, the element will be drawn which in
the z-coordinate is above the other element and will cover
it.
All the above-mentioned rules concern all visible
virtual instruments of the Control Web:
All visible 2D virtual instruments represent elements of
the GUI application. They have their rectangle and may be part
of the hierarchical structure. The rectangle of the instrument
is defined by keyword position (for instruments
with fixed dimensions the position contains only
the x and y coordinates, otherwise they contain four numbers
defining gradually the x and y coordinate, width and height of
the rectangle of the instrument), the owner of the instrument is
defined by keyword owner. The only instrument panel may not only be
owned by another panel, but it may also own other instruments.
The parameter owner of instruments may define the
name of the other panel or keyword background,
which says that the instrument will be directly on the
desktop.
The parameters position and owner
define the position of visible instruments in the tree of the
application GUI structure and as the only parameters they cannot
have any standard (default) values — there
is no standard position or standard owner. Therefore, if you drag
by mouse some instrument to the application, at last these two
parameters will always be defined:
  meter meter_1;
    gui
      owner = background;
      position = 10, 10, 180, 120;
    end_gui;
  end_meter;
Our first application contains only two instruments
meter and control located directly
on the desktop. The development environment also displays, in
addition to preview of the application, visual representation of
the tree structure of the application. On the left from the
desktop there is a panel with four areas named
Template, Visibility tree, Timing
tree and Selected Instrument (the ratios of the
size of these areas can be changed by dragging of the title by
mouse). The display of hierarchical dependence of instruments of
the application is in the area Visibility tree:
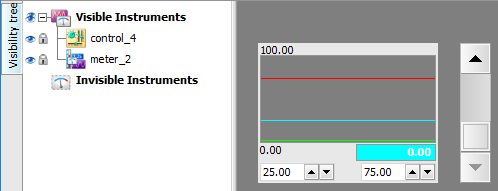
Display of the structure of visible
instruments If you insert the instrument panel into
the application (by dragging it from the palette), it will
appear at the same level (its owner will be background)
like other instruments. However, it was last inserted into the
application, it is at the highest level of the z-axis and will
cover other instruments. We need to place it under the
meter and control. There are
several possibilities how to do it:
Select the panel in the graphic editor and open the
context menu above it (by clicking the right mouse button). In
the menu there are the items To front, To
back, One up and One down, which
makes it possible to move the instrument in the z-coordinate.
Select the command To back and the panel is submerged
under the other instruments. The menu also offers keyboard shortcuts Keys <Ctrl>+<PgUp> to move the panel on the bottom as the command from
the menu. Or it is possible to press <PgDn> twice and
gradually submerge the panel under the other
instruments. The last possibility is to drag the instruments by mouse
in the visual presentation of the instrument trees (in the area
Visibility tree).
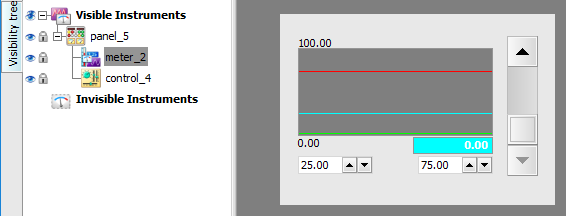
Application with panel We have the panel in this application,
but the instruments and the panel are still at one level, the
owner of all instruments (the panel is also a
virtual instrument) is the desktop (background). It
is easy to change ownership relations:
Select the respective instrument (meter or
control) and press the key <Ins>. The
development environment finds whether the left upper corner of
the selected instrument is located on the area of some panel and
if so it inserts the instrument into the respective
panel. It is possible to drag by mouse in the area
Visibility tree and paste it above the
panel.
This will change the owner of both instruments, the parameter
owner contains the name of the panel:
  ...
  owner = panel_1;
  ...
The graphic editor shows the rectangle of the owner by a dashed
line. If you select meter or
control, the rectangle of the panel is bordered by
a dashed line.
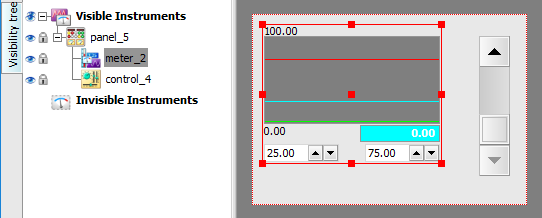
Instruments meter and
control registered in the instrument
panel Let’s notice that now the area of the panel “clips”
owner instruments. If you try to drag meter outside
the panel, you will not manage to do so:
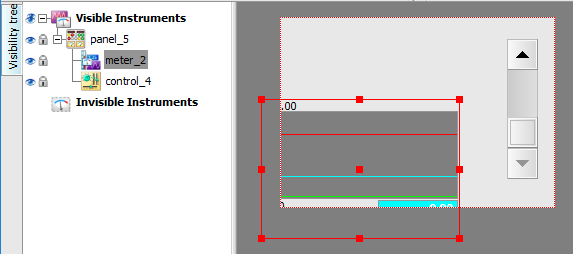
The area of the panel clips the areas of inserted
instruments But it is still not possible to handle such panel as a common
Windows application (e.g. drag it with a mouse). Sometimes it is
an intention (the panels over the whole screen represent the base
of the application and any handling on the part of the user is
undesired). However, if we wish the panel had the same frame as
other application windows, simply set the parameter type
in section window, which is a part of section gui
. This parameter can have the value normal (the
instrument will have its window which corresponds in its
appearance to Windows application windows), tool (the
window will be created used, e.g., for palettes with
tools — it is not possible to minimize this
window, it has a thinner title and does not have an icon in the
title) or none (the instrument in the application
will be without a window).
The other parameters make it possible to set the title of the
window (title) or disable handling of the window
(disable) — in our case it will
evidently be good to disable change in the size of the window and
its maximizing. The running application then looks like a common
window in the Windows environment:
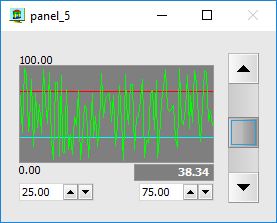
Running application with the instrument in the
window Hint: The frame of the window is not the exclusive property of
the instrument panel. In fact, each visible
instrument can be located in the window. However, similarly as in
the case of other applications, it is not useful to locate in the
window, e.g. an independent edit box, also in the case of
application of the Control Web system only panels
are located in windows as a rule. Step 4 — timing and activation
We set in the first step the timing (parameter period)
of the instrument meter for the value 0.1, which
ensured activation of the instrument ten times per second.
Periodical timing of the virtual instrument by means of the
parameter period is so far only manner used for the
activation of the instrument. In many cases it is not the best
solution.
Let’s start with the change of mode of the instrument
meter in our first application to display current
value without history. Open the inspector over the instrument
meter and set the parameter mode to
the value digital and you may return the parameter
history to the value 2 (the history in this mode is
not necessary). Due to the changed mode of the instrument you may
slightly modify the visual form of the application — it is for instance possible to change the mode of
the instrument control from the vertical to the
horizontal slider:
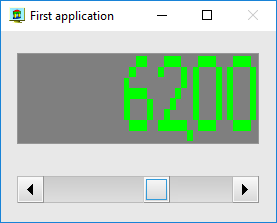
First application in changed form Let’s return to the activation of the instrument
meter. The value of the variable value
is changed only if the user moves the slider. If you do it say
once in an hour, the instrument meter performs a
thousand activations quite unnecessarily. Therefore, in the
Control Web system there is another possibility
of activation — each instrument can activate
another instrument only if it is necessary.
To be able to test this possibility, first of all cancel the
timing of the instrument meter. Simply delete the
parameter period in the inspector or in the
Timing tree pane (it is located on the left from the
working area of the development environment, under the
Visibility tree pane, where we modified the visual
structure of the application) drag the instrument
meter among non-timed instruments.
Now open the inspector above the instrument
control and set the parameter receivers.
This parameter contains the list of the names of instruments,
which the instrument control will activate always
in the case of change of its value. Type the name of the
instrument, which you want to activate (meter_2), as
the parameter value or open the auxiliary window in the inspector
making possible selection of the respective instrument from the
menu. Selection from the menu may be difficult due to the possibly
high number of instruments in the application. Therefore, the
inspector reduces the listed instruments only to one class. From
the combo-box Instruments classes in the left part,
select the required class of instruments (in our case
meter) and from the lists of all instances
(Instruments names) of the meter
instruments select the only one we want to activate. The
instrument meter_2 appears in the list on the right
side:
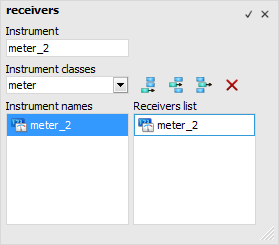
Auxiliary pop-up window of the inspector for editing of
the parameter receivers Hint: The parameter receivers may contain the list
of instruments, not only one instrument. It is also possible to
mix classes of individual instruments — it
is possible to activate, e.g. meter and
panel. In the text form of the application the value of the parameter
receivers is the simple list of names separated by
commas. The part of our first application will appear as
follows:
  control control_1;
    ...
    receivers = meter_2;
  end_control;

  meter meter_2;
    ...
  end_meter;
Our first application will operate at first sight
identically as before modification. Despite this fact there are
two very important differences in its running:
The instrument meter does not consume any
time if the user does not manipulate with the instrument
control. The instrument meter reacts to the change
of the value value in the nearest possible moment.
For periodical timing, the meter was activated
exactly (and the only!) ten times per second and if, for
example, the value value changed twenty times per
second, the meter displayed only every second
change. In the case of activation by the instrument
control the activation of the instrument
meter will always be carried out as soon as
possible. Let’s mention that it does not exclude the
possibility that the value of the variable value
will be changed several times between the activation of the
instrument meter. This can happen if the system
is very loaded and the computer does not manage to activate
meter more frequently than the user changes the
value value.
There are situations when periodical timing is necessary. For
example, in the previous version of our first application the
meter was in the graph mode and it was purposeful
to show the respective time history, not the history of the last
100 changes of value value regardless of the time. It
is possible to try to change the mode of the instrument
meter to flow_graph and history
to 100 and look at the application response.
Step 5 — communication with outside
world
The ability to read and write data from and into peripherals
for industrial automation is certainly one of the basic functions
of the Control Web system. A very important
feature is its consistently kept independence of concrete types of
hardware with which it communicates. It does not matter whether
the application reads and/or writes technological data through the
plug-in card directly in the computer, an independent unit
connected through some standard interface (RS-232C or RS-485, USB,
etc.), or an independent programmable logical controller.
This independence is achieved by the use of drivers of
industrial devices. The driver is an independent software
unit which on the one side implements the program interface
required by the Control Web system and, on the
other, implements all features of communication with the device
for which the driver is used. It hides device-specific features of
devices used. In terms of the remaining part of the system, all
equipment behaves the same.
Warning: Due to the different nature of various devices, the
behavior of various drivers differs. The basic differences are in
the time period during which the driver is able to return the
required data and in the reliability of the transfer. The driver,
which reads data directly from the measuring card inserted in the
slot of the computer, is able to return the data practically
immediately and quite reliably, whereas the driver, which reads
data through a slow (and possibly disturbed) serial line, will
have a response time considerably longer. So, it is possible
to say that during the design of the application we should rather
be interested in the speed and the volume of data which the
peripheral is able to provide depending on the requirements of the
application irrespective of the actual producer of the respective
hardware. On the part of the application the driver is accessible
through so-called channels. It is possible to consider
channels as being similar to variables with several
differences:
Unlike simple variables, which change the value only on the
basis of writing in the application, values of channels are
changed on the basis of data read from peripherals.
Because it is not possible to suppose which hardware is used by
users and which drivers are available, we will show the work with
drivers on virtual driver, which is delivered with each
installation of the Control Web system. Why
virtual? Despite the fact that this driver offers channels on
which various courses appear, in fact it does not communicate with
any peripherals — the values of channels are
calculated inside the driver.
Insert the driver into the application in the tab Data
Inspectors of the development environment. Make sure that in
the list of options in the left upper part there is either
All or Drivers. Then, you may click on the
item <add driver> and write its name; in our case
name the driver, e.g. drv:
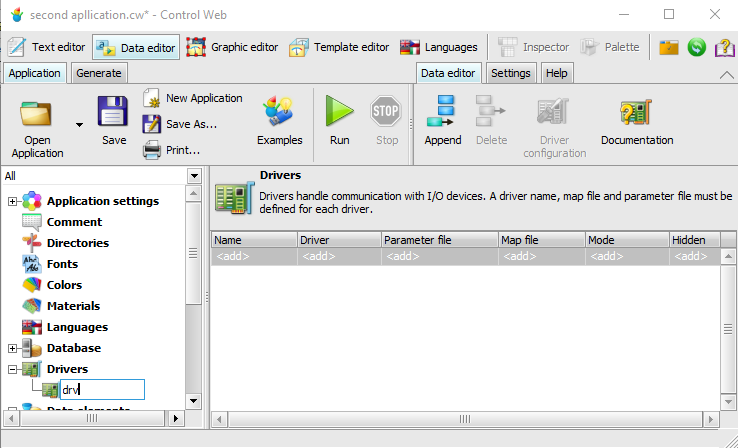
Adding a new driver After adding a new driver its definition appears in the graphic
development environment. However, the definition of the driver
must also contain other parameters in addition to the name. These
obligatory parameters are indicated in the development environment
in red text <expected data>.
Obligatory parameters of the definition of the
driver: | Parameter | Meaning |
|---|
| Driver | List of options with all drivers installed in the system.
Select the driver Virtual Device Driver. | | Map file | File with definition of channels of the driver. Open the
auxiliary window Driver Map File, switch to the
folder 'dmf' and select the file
'vsource.dmf': 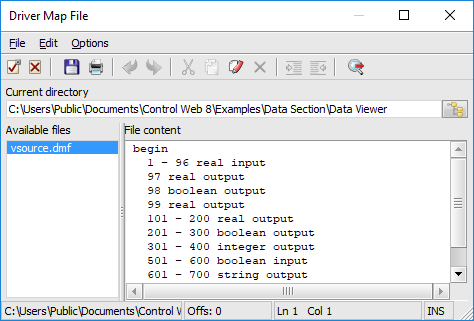
Window of selection of the map file | | Parameter file | File with configuration parameters of the respective
driver. Again using the window Driver Parameter File
select the file 'vsource.par' from the folder
'par': 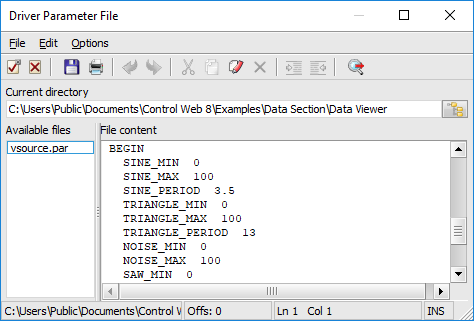
Parameter file selection window |
The such defined driver appears in the source text of the
application in the form of one line in the section driver:
driver
  drv : 'vsource.dll', 'vsource.dmf', 'vsource.par';
end_driver;
When the driver is established in the application you may
define channels. Similarly as in the first step when we defined
the variable (first of all, it was necessary to declare the
section of variables and then to declare the variable in this
section), we declare the section of channels channel
and create in this section the channel sinus:
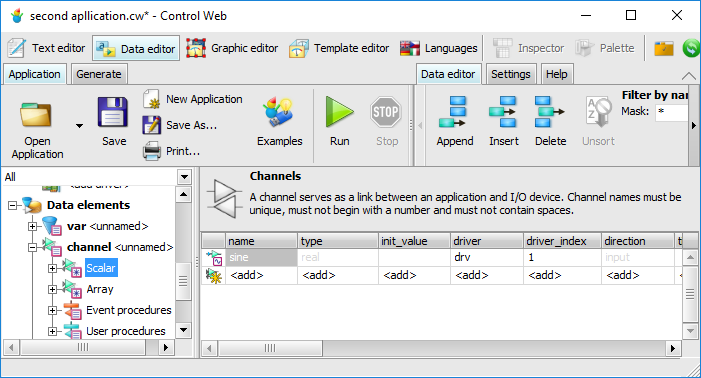
Channel sinus defined as the first channel
of the driver drv Then, it is enough to create the instrument
meter in the mode flow_graph whose
parameter expression will have the expression with
one channel sinus and with the timer (parameter
period) 0.1 s (do not forget to set history
for the value of 100). The running application will read ten times
per second the value of the channel sinus and display
it in the form of the graph:
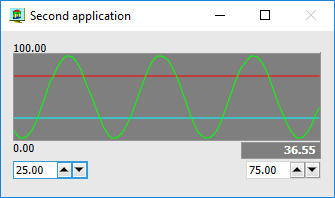
The instrument meter displays the value
of the channel sinus of the virtual
driver Configuration of drivers (creation of the parameter and map
file) by means of tools of the integrated development environment
is described in Chapter Communication with Peripherals — Drivers.
Step 6 — Boolean values
All currently used data elements were of numeric type (real).
Of course, the Control Web system is not
restricted to work only with numbers. In most cases, it is
necessary to work with conditions whose values have only two
statuses — true and false (represented by
keywords true and false in the
Control Web). For these logical values there is a
special data type boolean (this type was named after
the famous English mathematician George Bool). In addition to
“truth values” the denomination “binary values” is
used.
You meet logical values very often even if you do not define
any logical data element. For the instrument meter
we typed the value of the parameter expression
numeric expression, for example:
expression = 100 - value;
The instrument indicator is used to display
logical values. Although it also has the parameter expression,
the value of this parameter must have the expression of the type
boolean, whose evaluation results in either true
or false.
The fact that the expression must be of the type boolean
does not mean that it consists of only data elements of the type
boolean. Many operators and functions return a
logical value even if their arguments are numeric. The typical
example are relational (comparative) operators. The parameter
expression for the instrument
indicator may have the form:
expression = value > 50;
This expression will have the value true if the
number in the variable value is greater than 50,
otherwise it will have the value false.
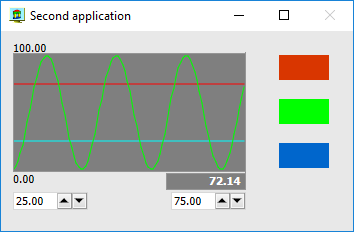
We will expand our second application so that in addition to
the instrument meter, which displays the course of
the channel sinus, it will also contains the
instrument indicator, which will signal that the
value of the channel sinus exceeds 50. The instrument
indicator can be found in the category Flat
instruments, Display, Logical. Drag it
into the panel beside the instrument meter. Now, it
suffices to set the parameters expression to the
sinus > 50 and period to 0.1. The
running application looks like this:
The instrument indicator signals that
the value of the channel sinus exceeds 50 The instrument indicator can be used more times
and using the parameters true_icon and false_icon
it is possible to modify its appearance. Then, it is possible to
create for the instrument the meter bar indicator:
Series of instruments
indicator Step 7 to n — anything you can think
of
Perhaps it is not possible to estimate the number of steps
which are necessary for detailed description of all features of
all instruments in the Control Web system and
related topics, for example, access to databases, HTTP protocol
used for transfer of HTML documents, Active X components, animated
drawings, visualization in 3D, etc. It is important to know the
basic general principles (and this Chapter serves for it) and then
to select the components and use the correct properties which suit
the respective application.
Mainly, take into consideration that for successful work with
the system it is not necessary to know detailed use of its
components. If the application does not have a WWW interface,
it is not necessary to understand the httpd
instrument, TCP/IP and HTTP protocols or the format of HTML
documents and you will create applications quickly and efficiently
for visualization and control of technologies. Similarly, it is
not necessary to deal with programming, control constructions of
algorithms, etc. Let’s concentrate on what you actually need. And
if the demands of the application change, you can return to those
components which are suitable for the solution.
Summary
Applications consist of virtual instruments and data
elements. Virtual instruments are inserted into the application by
dragging from the instrument palette in the Graphic
editor tab, data elements are added to the data sections
in the tab Data Inspectors. The properties of virtual instruments (e.g. with which
data elements they should work) are typed in the window of the
instrument inspector. Virtual instruments can be sorted into the tree structure
of visibility. The nodes of this tree are instruments of the
type panel. For real-time applications, instruments perform their
activities if they are activated. The exception are instruments
working on the initiation of the user (e.g.
control). Periodical timing is not the only way
of activating instruments. Another possibility is, e.g.
activation by another instrument. If you want to communicate with the outside world, you
have to use a driver for the peripheral in question. The
Control Web is consistently independent of the
hardware cooperating with it and it may cooperate with the
respective driver with any hardware or software system. In addition to numeric values, there may exist binary or
string values. Different instruments operate with various types
of value.
| 