Archiving one value and displaying in a trend
We explain the basic principles of archiving on the most
elementary example. We will want to archive one value and then
display it in a graph.
Let's start by creating one archive data element in the
application.
data
  alarm archiv1 {period = 1};
    arch_1 = rand() * 100;
  end_alarm;
end_data;
The period determines how often the result of the specified
expression will be archived. For data storage, we recommend using
the SQL server that is available during Control Web installation.
We let the created application run for a while so that we can
have some history and look at it later.
Now we will insert the data_viewer instrument into the
application, which will allow us to track the archive data.
data_viewer is a very powerful device that allows you to view
historical data in a table or graph. It is possible to choose from
a huge number of views, types of time or data axes and the like. A
complete description of this device would be published on a
separate article. We now only need the basic settings (a complete
device description can be found in the documentation).
In the instrument we have to set what data elements it will
display. data_viewer organizes data in groups. We need to create a
new group for our data element.
and text of this setting:
  data_viewer data_viewer_1;
    data_group
      group_name = 'group1';
      title = 'Skupina 1';
      data_elements
        item
          data_element = archiv1.arch_1;
        end_item;
      end_data_elements;
    end_data_group;
    active_group = 'group1';
  end_data_viewer;
Instrument data_viewer can work in two
modes::
online - the instrument is timed and displays the current
values. If a graph is displayed, the timeline ends with the
current time. Each time the graph is activated, the graph moves
by elapsed time. historical - the device displays historical data, the
user moves the time cursor by himself and views the
values.
Overview of data_viewer options for viewing archived
data
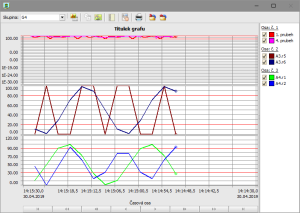 |
The example shows the options for archiving and
displaying graphs. There are several archived data sections
with different periods in the application. All values are
displayed in one browser (data_viewer). The entire
application can be downloaded here. |
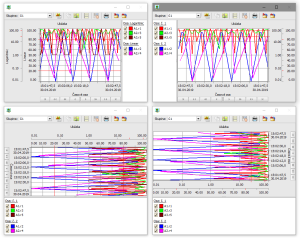 |
The application shows the possibilities of the
data_viewer to display the waveforms. The entire
application can be downloadedhere. |
Monitoring of limit values
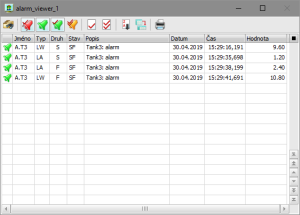 |
The example shows the simple use of the
alarm_viewer. The entire application can be downloadedhere. |
|